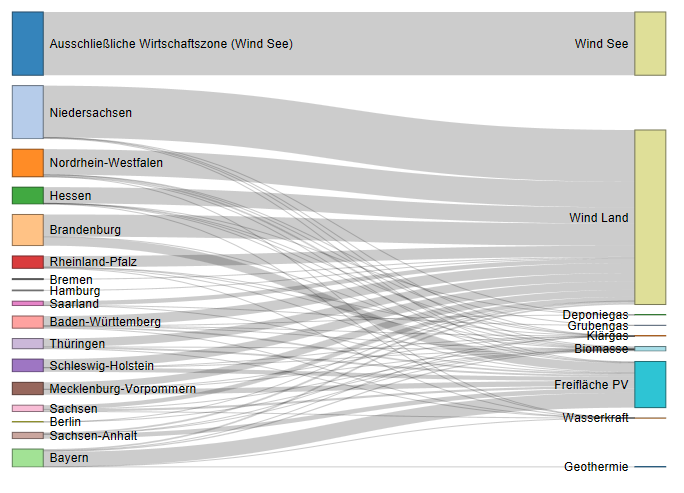
We will learn to create a Sankey-diagram. With its help proportions and flow can be visualised. The thickness of lines directly represensts quantities. Complex relationships can be shown. More information can be found.
Specifically it shows in which German federal state in which period since September 2014 how much new capacities of renewable energy is installed. Besides 16 federal states exclusive economic zone is shown.
- Objective: Create a Sankey-diagram
- Requirements: R-Basics
- Level: Advanced
Data Download and Preparation
Raw data is based on German “Anlagenregister”, in which all new renewable capacities are summarised.
First we load required packages. I use pacman to load all packages at once. It also checks if a package is installed. If not, it installs and then loads it.
We need the following packages:
- rio for data import
- networkD3 for Sankey diagram creation
- plyr, dplyr and tidyr for data preparation
We first download the data. Please check on the website if the shown url is still valid or needs an update.
library(pacman)
p_load(plyr, dplyr, tidyr, networkD3, knitr, rio)

anlagenregister <- import("./Anlagenregister.xlsx")
Now, data needs to be prepared. Some columns are renamed to english.
# rename colnames
anlagenregister$energy_source <- anlagenregister$`4.1 Energieträger`
anlagenregister$federal_state <- anlagenregister$`4.11 Bundesland`
anlagenregister$rated_power <- anlagenregister$`4.2 Installierte Leistung [kW]`
We want to filter for data from 2016. For this we need to extract year from timestamp column. Details on extraction of components are providing in … tutorial.
anlagenregister$commissioning_year <- unclass(as.POSIXlt(anlagenregister$Meldedatum)$year) + 1900
ddply is applied to summarise data. For each federal_state and energy_source the sum of rated power is calculated. Then, character vectors are casted to factors.
library(plyr) library(dplyr) register_energysource_fedstate <- anlagenregister %>% filter (Meldegrund == "Inbetriebnahme") %>% filter (commissioning_year == 2018) %>% ddply(.(federal_state, energy_source), summarise, installed_power = sum(rated_power)/1000) %>% filter (!is.na(federal_state)) %>% arrange (desc(installed_power))# characters to factorsregister_energysource_fedstate$federal_state <- as.factor(register_energysource_fedstate$federal_state) register_energysource_fedstate$energy_source <- as.factor(register_energysource_fedstate$energy_source) kable(head(register_energysource_fedstate))
| federal_state | energy_source | installed_power | name | source | target | source |
|---|---|---|---|---|---|---|
| Ausschließliche Wirtschaftszone (Wind See) | Wind See | 974.8000 | Wind See | 0 | 17 | 0 |
| Niedersachsen | Wind Land | 798.7815 | Wind Land | 1 | 18 | 1 |
| Nordrhein-Westfalen | Wind Land | 392.8758 | Wind Land | 2 | 18 | 2 |
| Brandenburg | Wind Land | 341.5510 | Wind Land | 3 | 18 | 3 |
| Hessen | Wind Land | 249.8100 | Wind Land | 4 | 18 | 4 |
| Bayern | Freifläche PV | 227.7703 | Freifläche PV | 5 | 19 | 5 |
At this point we can bring everything in place for creation of Sankey-diagram. We need nodes, sources, targets and values. Nodes include all names used in the diagram. Each source is connected to one or more targets and vice versa. The values indicate the thickness of the connecion.
It is important to make sure that sources and targets are numerics, and start with zero.
First, all node names are extracted and numbered, starting with zero.
# create nodes
register_energysource_fedstate$name <- register_energysource_fedstate$federal_state
nodes <- data.frame (name = as.factor(c(unique(as.character(register_energysource_fedstate$federal_state)),
                    unique(as.character(register_energysource_fedstate$energy_source)))))

nodes$number <- 1:nrow(nodes)-1
Sources, targets and values wil be summarised in a dataframe links. We will use node-numbers for assigning sources and targets to corresponding numbers. left_join will be used for this purpose. First, name column in register_energysource_fedstate represents federal_state. After joining with nodes dataframe
# get numbers for Bundesland and Energieträger
library(networkD3)
register_energysource_fedstate <- left_join(register_energysource_fedstate, nodes, by = "name")
colnames(register_energysource_fedstate) <- gsub("number", "source", colnames(register_energysource_fedstate))
register_energysource_fedstate$name <- register_energysource_fedstate$energy_source
register_energysource_fedstate <- left_join(register_energysource_fedstate, nodes, by = "name")
colnames(register_energysource_fedstate) <- gsub("number", "target", fixed = T, colnames(register_energysource_fedstate))


# create links
links <- data.frame (source = register_energysource_fedstate$source,
            target = register_energysource_fedstate$target,
            value = register_energysource_fedstate$installed_power)

sankeyNetwork(Links = links,
         Nodes = nodes,
         Source = "source",
         Target = "target",
         Value = "value",
         NodeID = "name",
         units = "MW", fontSize = 12, nodeWidth = 30, fontFamily = "Arial")
More Information
- German “Anlagenregister” (Register on Renewable Energies) https://www.bundesnetzagentur.de/DE/Sachgebiete/ElektrizitaetundGas/Unternehmen_Institutionen/ErneuerbareEnergien/Anlagenregister/Anlagenregister_Veroeffentlichung/Anlagenregister_Veroeffentlichungen_node.html
- Wikipedia Article on Sankey Diagram https://de.wikipedia.org/wiki/Sankey-Diagramm)