This interactive globe shows installed power for countries with largest wind energy installations. I will show you how to create the globe and add country-specific information.
- Objectives: Learn to create an interactive globe,
- Requirements: Web-Scraping
Data Download
We start by loading required packages. We need rvest for web-scraping (downloading a table from the internet and converting it to a dataframe). We use dplyr for data handling.
Wind energy installation data is downloaded from Wikipedia. This tutorial is not on Web-Scraping. Details on this example are explained in tutorial … .
Data Preparation
Some data requires rework. Some country names, like Australia, contain some undesired characters, which we delete. Groups of countries, like European Union, are aggregated. We delete these datasets completely. Finally, wind installations in 2015 (most recent information) are binned with cut().
# correct names
wind$Nation[wind$Nation == "Australia[23]"] <- "Australia"
wind$Nation[wind$Nation == "Norway[24][25][26]"] <- "Norway"
wind$Nation[wind$Nation == "Pakistan[27]"] <- "Pakistan"

# remove pseudo countries
wind <- wind[-which(wind$Nation == "European Union"), ]
wind <- wind[-which(wind$Nation == "Rest of Europe"), ]
wind <- wind[-which(wind$Nation == "Rest of Latin America & Caribbean"), ]
wind <- wind[-which(wind$Nation == "Rest of Africa & Middle East"), ]
wind <- wind[-which(wind$Nation == "Rest of Asia"), ]
wind <- wind[-which(wind$Nation == "World total capacity (MW)"), ]

wind$power_2017_bin <- as.numeric(cut(wind$last_year, breaks = c(0, 5000, 10000, 20000, 40000, 200000)))
We start creating the plot. First, we need to load maptools package, because it contains “wrldsimpl”. This object has spatial information on countries and borders. A background color is defined and stored in “bgcolor”. A jpeg image is prepared with _jpeg() and its parameters set with par().
Our color code is defined in “map_palette”. In the next step “wind” dataframe is filtered. We need to do a matching, because we only can ink countries, that are included in “wrld_simple”.
We create a character vector “clrs”. Its length equals the number of countries in “wrldsimple” and its _names() are set to country names in “wrld_simple”. First, a default color is assigned to all countries. Then, at each country within “wind” dataframe, the corresponding color palette is assigned.
At the last step in this chunk we plot the world map.
library(maptools)
data("wrld_simpl")  # Basic country shapes
bgcolor <- "#000025"
earth <- tempfile(fileext=".jpg")
jpeg(earth, width=4096, height=2048, quality=100, bg=bgcolor, antialias="default")
par(mar = c(0,0,0,0),    pin = c(4,2),    pty = "m",    xaxs = "i",
    xaxt = "n",          xpd = FALSE,    yaxs = "i",    yaxt = "n")

map_palette <- c("#A0A0A0","#00FF00", "#FFFF00", "#FF8000", "#FF0000")

wind <- wind[wind$Nation %in% wrld_simpl$NAME, , drop = F]

# setting colors
clrs <- rep( "#E0E0E0", length(wrld_simpl$NAME))
names(clrs) <- wrld_simpl$NAME
clrs[wind$Nation] <- map_palette[wind$power_2017_bin]

# plot world map
plot(wrld_simpl,  col=clrs,   bg=bgcolor,        border="black",  ann=FALSE,
     axes=FALSE,  xpd=FALSE,  xlim=c(-180,180), ylim=c(-90,90),  setParUsrBB=TRUE)
Create the World
Now we come to the end and load threejs package, which is required to plot the globe. graphics.off() shuts down all open graphics devices. With globejs() function we create the globe by passing our “earth” image path. The background color is set to “white”.
library(threejs)
graphics.off()
globejs(earth,  bg="white")
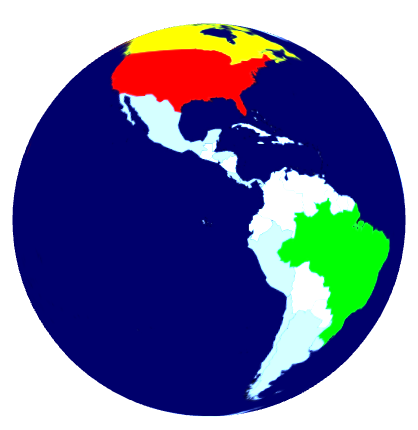
Click on it to open a new tab with the full interactive globe.
You can drag the globe and rotate it. The wind energy installations are color coded.
- no information
- 0-5 MW
- 5-10 MW
- 10-20 MW
- 20-40 MW
- greater 40 MW
More Information
- Wind Energy Installations https://en.wikipedia.org/wiki/Wind_power_by_country